Guide to Exporting HTML Tables to Excel in React with exceljs
Discover how to effortlessly export HTML tables from your React app with the power of exceljs.


I recently had a requirement in a project to export HTML tables to Excel. I was using React (Next.js to be precise) and wanted to find a way to export HTML tables to Excel. I found a library called exceljs that allows you to export HTML tables to Excel. In this guide, We'll break down each step, from installation and configuration to styling your exported data and adding formulas to it.
Prerequisites
A basic understanding of
ReactandJavaScript.Node.jsand a package manager likenpminstalled on your system.Optional: Basic understanding of
TypeScriptas all of the code is in TypeScript but even if you don't know TypeScript you'll still be able to understand the code.Optional: Basic understanding of
Next.jsas we will be using Next for this guide but even if you have never used Next, you'll still be able to understand the code as long as you have an understanding of React and JavaScript.
Setting up the project
Let's start by creating a new
Next.jsproject. You can do this by running the following command in your terminal:npx create-next-app@latestNext, we need to install the exceljs package. This package is an Excel workbook manager which is the MVP of this guide. You can install it by running the following command in your terminal:
npm i exceljsNow that our project is set up, let's start writing some code!
Creating Table Data
Before we export the table to Excel, we need to create some table data. For this guide, we'll create some simple tables with some dummy data that are interrelated to each other. Let's create a data folder at the root of our project and create a file called tableData.ts inside it. Add the following code to the file:
export const productsTable = [
  { ID: 1, name: "Shirt", price: 20, discount: 0.1 },
  { ID: 2, name: "Hat", price: 15, discount: 0.05 },
  { ID: 3, name: "Shoes", price: 40, discount: 0.2 },
];

export const customersTable = [
  { ID: 100, name: "Jude", location: "Birmingham" },
  { ID: 101, name: "Toni", location: "Germany" },
  { ID: 102, name: "Luka", location: "Croatia" },
];

export const ordersTable = [
  {
    ID: 500,
    customerID: 100,
    productID: 1,
    quantity: 2,
  },
  { ID: 501, customerID: 101, productID: 2, quantity: 1 },
  { ID: 502, customerID: 102, productID: 3, quantity: 3 },
];

export const orderDetailsTable = [
  {
    orderID: 500,
    productID: 1,
    totalAmount:
      productsTable[0].price *
      (1 - productsTable[0].discount) *
      ordersTable[0].quantity,
  },
  {
    orderID: 501,
    productID: 2,
    totalAmount:
      productsTable[1].price *
      (1 - productsTable[1].discount) *
      ordersTable[1].quantity,
  },
  {
    orderID: 502,
    productID: 3,
    totalAmount:
      productsTable[2].price *
      (1 - productsTable[2].discount) *
      ordersTable[2].quantity,
  },
];
Rendering the Tables
Now that we have our table data, let's create a component that will render the tables. Create a new file called Table.tsx inside the components folder in the root of your project and add the following code to it:
import React from "react";

import { startCase } from "lodash";

type Props = {
  caption: string;
  tableData: {
    [key: string]: string | number;
  }[];
};

const Table = ({ caption, tableData }: Props) => {
  return (
    <div>
      <table>
        <caption>{caption}</caption>
        <thead>
          <tr>
            {Object.keys(tableData[0]).map((header, index) => (
              <th key={index}>{startCase(header)}</th>
            ))}
          </tr>
        </thead>

        <tbody>
          {tableData.map((row, index) => (
            <tr key={index}>
              {Object.values(row).map((cell, index) => (
                <td key={index}>{cell}</td>
              ))}
            </tr>
          ))}
        </tbody>
      </table>
    </div>
  );
};

export default Table;
We'll use this component to render all our tables. It takes two props - the caption of the table and the table's data. Since all the entries in the table data will have the same keys, we are mapping over the keys of the first entry in the table data in order to render the column headers. As for the rows, we're mapping over all the entries and for each entry we're mapping over the values of each of the keys.
Now let's import this component in our page.tsx file in order to render it for all our tables. Go over to your page.tsx file and add the following code:
import React from "react";

import {
  productsTable,
  customersTable,
  ordersTable,
  orderDetailsTable,
} from "@/data/tableData";

import "@/app/globals.css";

import Table from "@/app/components/Table";

export default function Home() {
  return (
    <main>
      <h1>Data to Excel</h1>

      <Table tableData={productsTable} caption="Products" />
      <Table tableData={customersTable} caption="Customers" />
      <Table tableData={ordersTable} caption="Orders" />
      <Table tableData={orderDetailsTable} caption="Order Details" />
    </main>
  );
}
Nothing special here, just importing our component and passing it our table data as props with a suitable caption.
Converting to Excel
Let's create a function that will convert our HTML tables to Excel. Create a new file called 'convertToExcel.ts' in the 'utils' folder in the root of the project. Before we start writing the function let's create some types first, that we'll need:
types/TableRow
export type TableRow = { [key: string]: string | number | boolean };
types/TableName
export enum TableName {
  ORDER_DETAILS = "Order Details",
  ORDERS = "Orders",
  PRODUCTS = "Products",
  CUSTOMERS = "Customers",
}
types/TableData
import { TableName } from "@/types/TableName";

export type TableData = {
  name: TableName;
  table: { [key: string]: any }[];
};
types/Sheets
import { TableData } from "@/types/TableData";

export type Sheets = { name: string; data: TableData[] }[];
You'll get to know what these types are for as we use them in our code. Now let's create a basic signature for our convertToExcel function:
import ExcelJS, { Worksheet } from "exceljs";

import { Sheets } from "@/types/Sheets";

export const convertToExcel = (sheets: Sheets) => {
  // create a new workbook

  // loop over sheets
  sheets.forEach((sheet) => {
    // if worksheet name already exists in the workbook, skip it since apps can't have duplicate names

    // add sheet to workbook

    // default column width & row height

    // loop over tables
    sheet.data.forEach((table, i) => {
      // add title row

      // add header row

      // add columns

      // loop over rows
      table.table.forEach((row, position) => {
        // add formulas and data row

      });

      // add empty rows between tables for better readability
      worksheet.addRows([[], [], [], []]);
    });
  });

  // Generate the Excel file
};
So here is the flow:
We create an Excel Workbook.
Loop over all the different sheets that may have one or more tables.
Add a title row i.e. Table Caption.
Add a header row for column names.
Add columns using the keys of the table data.
Loop over each row.
Add data row and formulas if any.
Add empty rows between tables for readability.
Return the generated Excel file.
Now let's Start adding some code for these steps, starting with the workbook:
import ExcelJS, { Worksheet } from "exceljs";

import { Sheets } from "@/types/Sheets";

export const convertToExcel = (sheets: Sheets) => {
  // create a new workbook
  const workbook = new ExcelJS.Workbook();

  // loop over sheets
  sheets.forEach((sheet) => {
    // if worksheet name already exists in the workbook, skip it since apps can't have duplicate names
    if (workbook.getWorksheet(sheet.name)) return;

    // add sheet to workbook
    const worksheet = workbook.addWorksheet(sheet.name);

    // default column width & row height
    worksheet.properties.defaultColWidth = 20;
    worksheet.properties.defaultRowHeight = 25;

    // loop over tables
    sheet.data.forEach((table, i) => {
      // add title row

      // add header row

      // add columns

      // loop over rows
      table.table.forEach((row, position) => {
        // add formulas and data row

      });

      // add empty rows between tables for better readability
      worksheet.addRows([[], [], [], []]);
    });
  });

  // Generate the Excel file
};
We have created our Workbook. While looping over all the sheets in the data, we're first checking if a sheet with the same name is already added to avoid duplicates. Then we add that sheet to the workbook that we created and the default columnWidth and RowHeight. You can play around with these values. Let's move on to the title row now:
const addTitleRows = (
  worksheet: Worksheet,
  tableName: string,
  index: number,
  columnNumber: number
) => {
  let titleRow;

  // Add the table title to the worksheet
  if (index === 0) {
    titleRow = worksheet.insertRow(1, [convertToTitleCase(tableName)]);
    titleRow.hidden = true;
  }

  titleRow = worksheet.addRow([convertToTitleCase(tableName)]);

  // title row styling
  addStyling("FFFFFF", titleRow);

  // merge cells according to number of columns
  worksheet.mergeCells(titleRow.number, 1, titleRow.number, columnNumber);

  // set the title row's background color
  worksheet.getCell(titleRow.number, 1).fill = {
    type: "pattern",
    pattern: "solid",
    fgColor: { argb: "222222" },
    bgColor: { argb: "222222" },
  };
};

const addStyling = (color: string, row: ExcelJS.Row) => {
  // set the row's font, alignment & border
  row.font = {
    name: "Calibri",
    bold: true,
    color: {
      argb: color,
    },
  };

  row.alignment = { horizontal: "center", vertical: "middle" };

  // add border to cells of the row
  row.eachCell((cell) => {
    if (cell.value) {
      cell.border = {
        top: { style: "double" },
        left: { style: "double" },
        bottom: { style: "double" },
        right: { style: "double" },
      };
    }
  });
};
We have created a function to add the title row, it takes the following params: the worksheet object, table name, index of the table in the data and the columnNumber to determine how many columns the table will occupy.
First we are creating a hidden row to avoid some weird behaviour of the library, I'm not sure what causes it or what's the purpose of it. But you can try removing that code if you want to investigate it. Next up, we create the titleRow using the worksheet.addRow method. For the styling of the table we have created a separate function called addStyling. It takes a colour and the row object as params. It sets the row's font, alignment & border in addition to adding borders to the table cells.
Let's call this addTitleRow function in the convertToExcel function:
    ....
    // loop over tables
    sheet.data.forEach((table, i) => {
      // add title row
      const columnNumber = Object.keys(table.table[0]).length;
      addTitleRows(worksheet, table.name, i, columnNumber);
      ...
Up next, let's create a similar function for adding the header row:
const addHeaderRow = (worksheet: Worksheet, table: TableData) => {
  const headers = Object.keys(table.table[0]).map((key: string) =>
    convertToTitleCase(key)
  );

  const headerRow = worksheet.addRow(headers);

  // header row styling
  addStyling("000", headerRow);
};
This function takes the worksheet object and a single table's data as params. We are converting the keys of the tableData to an array of title case header names and passing it to the worksheet.addRow method. Similar to the title row, we're adding styling to the header row as well but using a different colour. Now let's call this function in the convertToExcel function:
    ...
    // loop over tables
    sheet.data.forEach((table, i) => {
      // add title row
      const columnNumber = Object.keys(table.table[0]).length;
      addTitleRows(worksheet, table.name, i, columnNumber);

      // add header row
      addHeaderRow(worksheet, table);
      ...
It's time to define the columns using the keys of the tableData entries. Let's create a function for that:
const addColumns = (worksheet: Worksheet, table: TableData) => {
  worksheet.columns = Object.keys(table.table[0]).map((key: string) => ({
    key,
    header: convertToTitleCase(key),
    width: 20,
  }));
};
Similar to the addHeaderRow function, it takes the worksheet object and a single table's data as params. We are mapping over the keys of the table data and returning an array of objects for each column that contains it's accessor key, header name and the column's width which we are assigning to worksheet.columns. Now let's call this function in the convertToExcel function:
    ...
    // loop over tables
    sheet.data.forEach((table, i) => {
      // add title row
      const columnNumber = Object.keys(table.table[0]).length;
      addTitleRows(worksheet, table.name, i, columnNumber);

      // add header row
      addHeaderRow(worksheet, table);

      // add columns
      addColumns(worksheet, table);
      ...
Now for the most important part - the data. Let's loop over each table data row and add it to the worksheet along with the formulas:
const addDataRows = (
  worksheet: Worksheet,
  row: TableRow,
  tableName: TableName,
  position: number
) => {
  const dataRow = worksheet.addRow(Object.values(row));

  dataRow.font = {
    name: "Calibri",
  };

  dataRow.alignment = { horizontal: "center", vertical: "middle" };

  dataRow.eachCell((cell) => {
    if (cell.col) {
      cell.border = {
        top: { style: "double" },
        left: { style: "double" },
        bottom: { style: "double" },
        right: { style: "double" },
      };
    }
  });

  // formulas
  if (tableName === TableName.ORDER_DETAILS) {
    const accessPosition = position + 4;

    const cellPosition = `C${dataRow.number}`;
    const formula = `INDIRECT("'${TableName.PRODUCTS}'!C${accessPosition}") * (1 - INDIRECT("'${TableName.PRODUCTS}'!D${accessPosition}")) * D${accessPosition}`;

    addFormulae(worksheet, cellPosition, formula);
  }
};

const addFormulae = (
  worksheet: Worksheet,
  cellPosition: string,
  formula: string
) => {
  worksheet.getCell(`${cellPosition}`).value = {
    formula,
    date1904: false,
  };
};
We've created two functions - addDataRows for the data and addFormulae for the formulas. The addDataRow function takes the worksheet object, the row object, the table name and the position of the row in its table as params. We add the data row using the values of the table row entry with the worksheet.addRow method. Then we add some font, alignment and border styling to the row. Then we are adding the formula for the order details table. The accessPosition is the position of the cell to access from the products table, we need it to generate the formula. The cellPosition is nothing but the position of the cell on which we want to add the formula. The addFormulae function takes the worksheet object, cellPosition and the formula as params and adds the formula for the given cell position.
Let's call this function in the convertToExcel function:
    ...
    // loop over tables
    sheet.data.forEach((table, i) => {
      // add title row
      const columnNumber = Object.keys(table.table[0]).length;
      addTitleRows(worksheet, table.name, i, columnNumber);

      // add header row
      addHeaderRow(worksheet, table);

      // add columns
      addColumns(worksheet, table);

      // loop over rows
      table.table.forEach((row, position) => {
        // add formulas and data row
        addDataRows(worksheet, row, table.name, position);
      });

      // add empty rows between tables for better readability
      worksheet.addRows([[], [], [], []]);
      ...
Finally here is the full convertToExcel function after returning the generated Excel file:
export const convertToExcel = (sheets: Sheets) => {
  // create a new workbook
  const workbook = new ExcelJS.Workbook();

  // loop over sheets
  sheets.forEach((sheet) => {
    // if worksheet name already exists in the workbook, skip it since apps can't have duplicate names
    if (workbook.getWorksheet(sheet.name)) return;

    // add sheet to workbook
    const worksheet = workbook.addWorksheet(sheet.name);

    // default column width & row height
    worksheet.properties.defaultColWidth = 20;
    worksheet.properties.defaultRowHeight = 25;

    // loop over tables
    sheet.data.forEach((table, i) => {
      // add title row
      const columnNumber = Object.keys(table.table[0]).length;
      addTitleRows(worksheet, table.name, i, columnNumber);

      // add header row
      addHeaderRow(worksheet, table);

      // add columns
      addColumns(worksheet, table);

      // loop over rows
      table.table.forEach((row, position) => {
        // add formulas and data row
        addDataRows(worksheet, row, table.name, position);
      });

      // add empty rows between tables for better readability
      worksheet.addRows([[], [], [], []]);
    });
  });

  // Generate the Excel file
  return workbook.xlsx.writeBuffer();
};
Exporting the Excel File
We are done with the hardest part - the logic of converting our data into a Excel workbook. Now we need the functionality to export the generated Excel file. Let's create a component for it. Create a file called ExportData.ts in the components folder and write the following code in it:
"use client";

import React from "react";

import { saveAs } from "file-saver";

import { Sheets } from "@/types/Sheets";
import { TableData } from "@/types/TableData";
import { convertToExcel } from "@/utils/convertToExcel";

type Props = {
  orderSummary: TableData[];
  products: TableData;
  customers: TableData;
};

const ExportData = ({ orderSummary, products, customers }: Props) => {
  const handleExport = () => {
    const sheets: Sheets = [];

    sheets.push({
      name: "Orders Summary",
      data: orderSummary,
    });

    sheets.push({
      name: "Products",
      data: [products],
    });

    sheets.push({
      name: "Customers",
      data: [customers],
    });

    try {
      convertToExcel(sheets).then((buffer) => {
        const blob = new Blob([buffer], {
          type: "application/vnd.openxmlformats-officedocument.spreadsheetml.sheet",
        });

        saveAs(blob, "data.xlsx");
      });
    } catch (error) {
      console.error(error);
    }
  };

  return <button onClick={handleExport}>Export</button>;
};

export default ExportData;
This component will take the sheets we want in our Excel workbook as props. Since the order summary sheet will have two tables, that will be an object as opposed to the products and customers sheets. We are rendering a simple Export button which will take an onClick handler that'll do all the magic.
Inside the handleExport function, we are initialising an empty sheets array and pushing all of our sheets into it as an array of objects which contains the name of the sheet along with the sheet data which will be an array. We are then passing the sheets array to our convertToExcel function which results are promise that resolves to a buffer value. We are creating a new blob object of the spreadsheet type using that buffer value. You are gonna need to install a package called file-saver for the next part, which will help us download the Excel file. We are passing our blob to the saveAs function along with the name of the file you want to download.
Let's import this ExportData component in our page.tsx file:
import React from "react";

import {
  productsTable,
  customersTable,
  ordersTable,
  orderDetailsTable,
} from "@/data/tableData";

import "@/app/globals.css";

import Table from "@/app/components/Table";
import ExportData from "@/app/components/ExportData";
import { TableName } from "@/types/TableName";

export default function Home() {
  return (
    <main>
      {/* heading with export button */}
      <h1>Data to Excel</h1>
      <ExportData
        orderSummary={[
          {
            name: TableName.ORDERS,
            table: ordersTable,
          },
          {
            name: TableName.ORDER_DETAILS,
            table: orderDetailsTable,
          },
        ]}
        products={{
          name: TableName.PRODUCTS,
          table: productsTable,
        }}
        customers={{
          name: TableName.CUSTOMERS,
          table: customersTable,
        }}
      />

      {/* Render the tables */}
      <Table tableData={productsTable} caption="Products" />
      <Table tableData={customersTable} caption="Customers" />
      <Table tableData={ordersTable} caption="Orders" />
      <Table tableData={orderDetailsTable} caption="Order Details" />
    </main>
  );
}
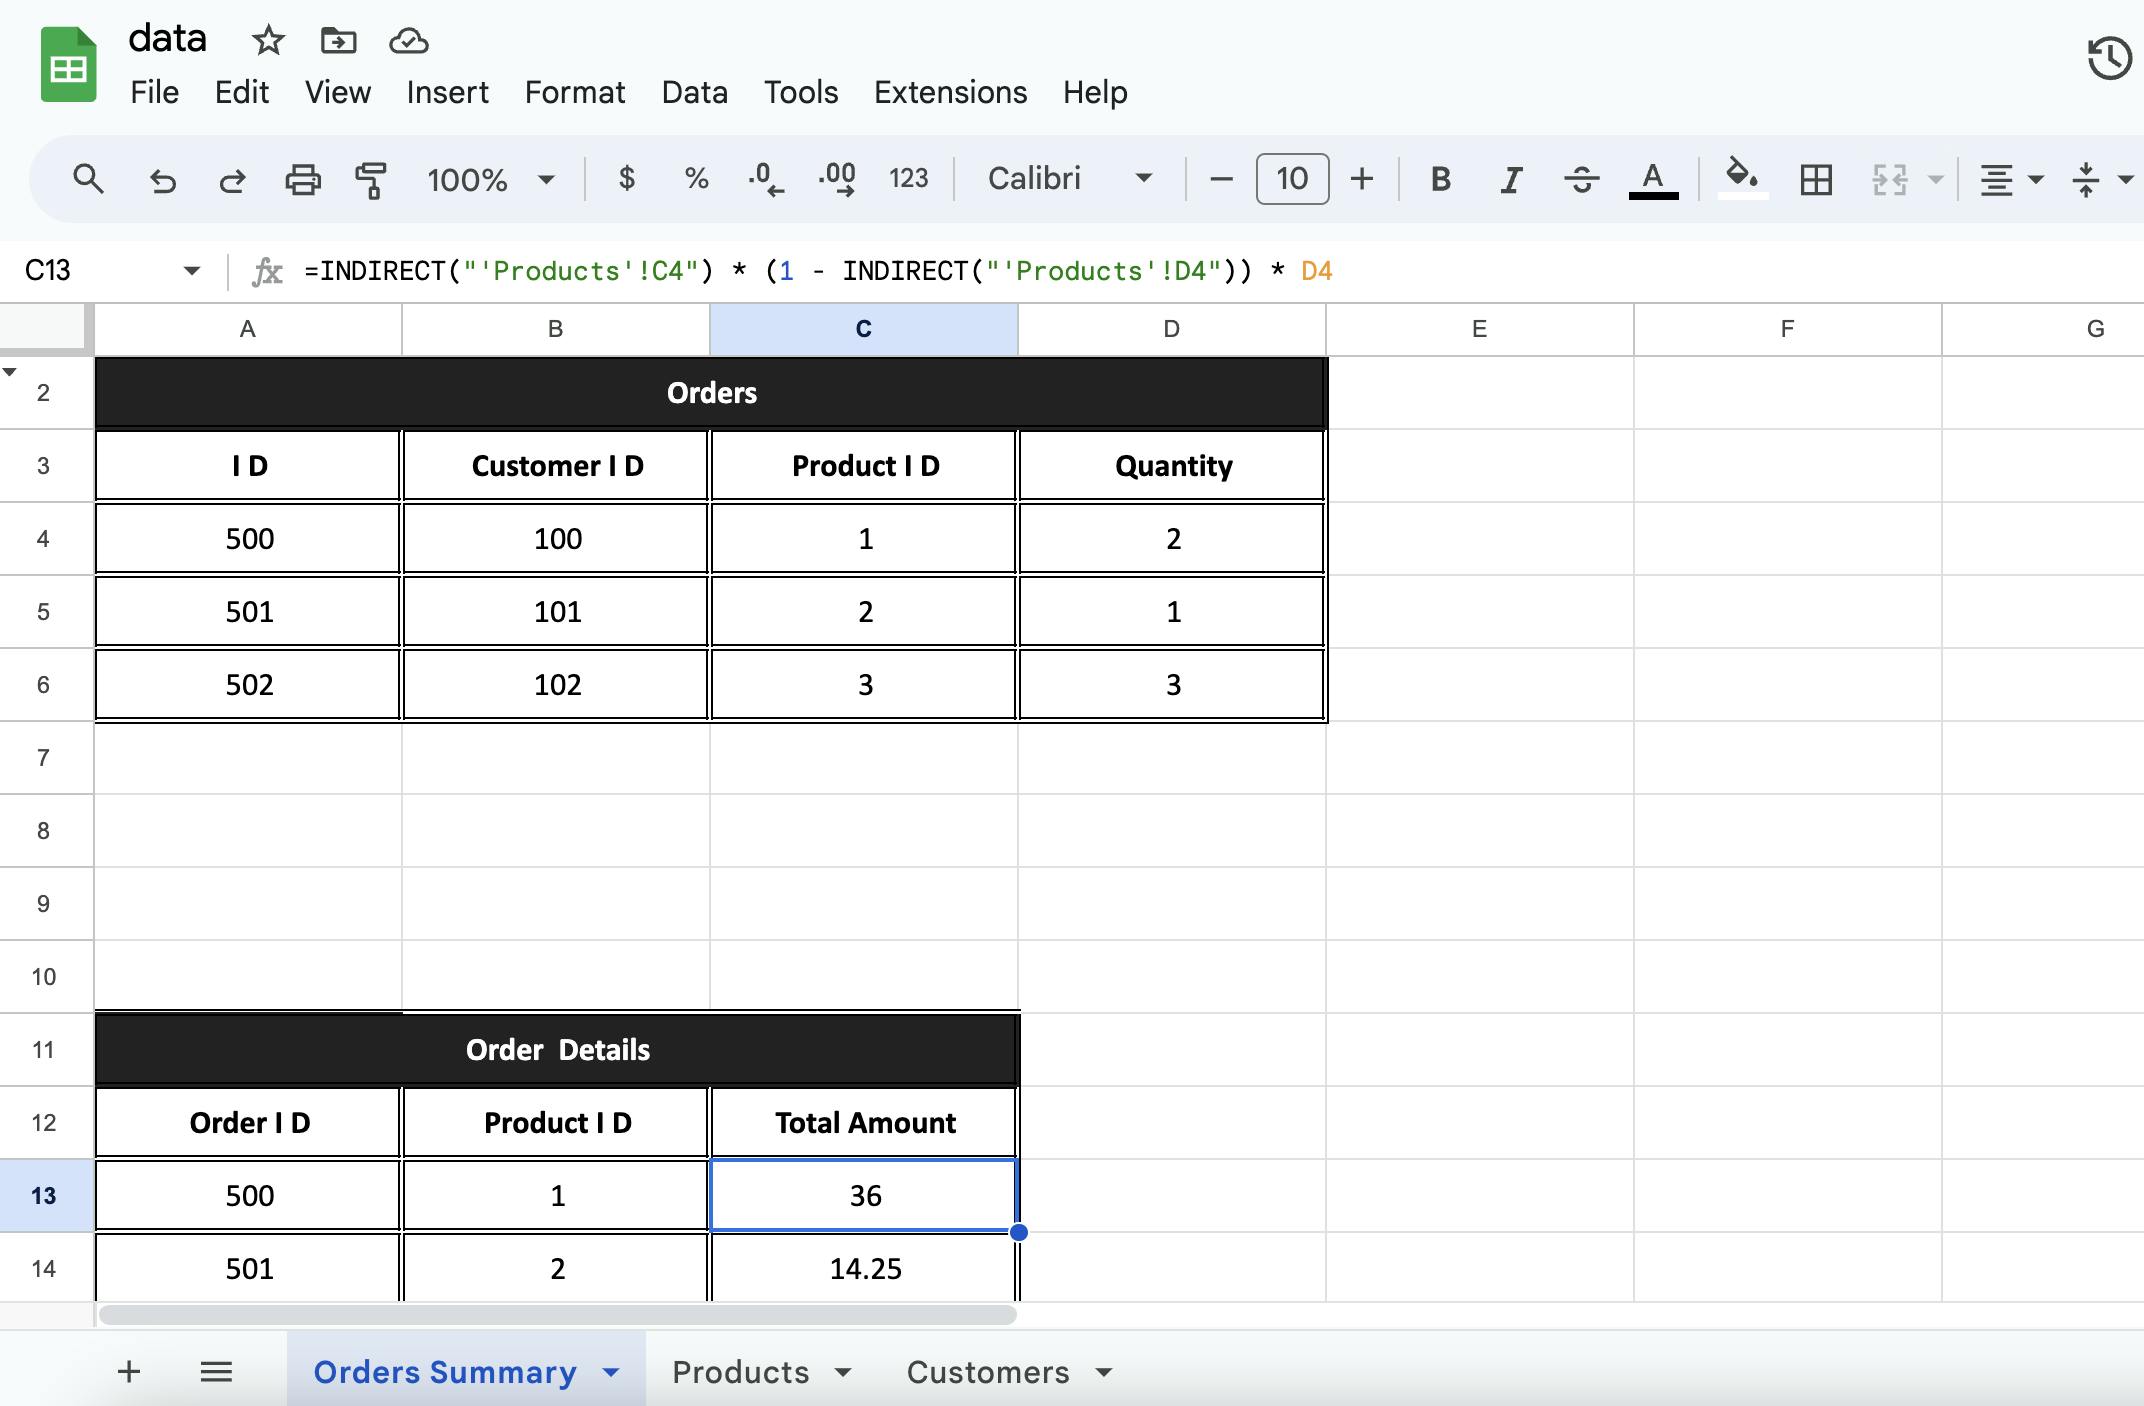
Now let's see what our final result looks like:

Conclusion
In this guide, we learned how to export HTML tables to Excel in React using the exceljs library. We started by setting up a new Next.js project and installing the exceljs package. We then created some table data and rendered the tables in a component. Finally, we created a function that converts the data to Excel. You can now export your HTML tables to Excel in your React app with ease.